Leaflet十大常用功能合集

        本篇文章主要介绍基于leaflet开源地图组件开发的地图搭建,包含热力图、Geojson轨迹、marker、动画、用户标记侧栏、测量工具、搜索框、经纬线显示等功能。
        本文中的代码都是经过测试无误的,关于依赖包均可在github上找到源文件,主要就是依赖导入和函数调用两部分,为了简洁,json数据一般外部导入,路径正确即可。

底图导入

        地图的导入分在线和离线,在线直接调提供瓦片服务的url即可,离线请参考我的另一文章:基于leaflet的离线瓦片发布方式总结 代码如下:

1
2
3
4
5
6
7
8
9
10
11
12
13
14
15
16
17
18
19
20
21
22
23
24
25
26
27
28
29
30
31
32
33
34
35
36
37
38
39
40
41
42
43
44
45
46
47
48
49
50
51
52
53
54
55
56
57
58
59
60
61
62
63
64
<!DOCTYPE html>
<html>
<head>

<title>Offline Map by WHU</title>

<meta charset="utf-8" />
<meta name="viewport" content="width=device-width, initial-scale=1.0">

<link rel="shortcut icon" type="image/x-icon" href="docs/images/favicon.ico" />

<!-- 导入外部的js或者css (组件的依赖) -->
<link rel="stylesheet" href="./css/leaflet.css"/>
<script src="./js/leaflet.js"></script>


<!-- 动画轨迹js -->
<script type="text/javascript" src="./js/MovingMarker.js"></script>
<!-- 导入外部json -->
<script type="text/javascript" src="./json/heatpoint.js"></script>
<style>
*
* { margin: 0; padding: 0; }
html, body { height: 100%; }
/* html,body {
padding: 0;
margin: 0 auto;
width: 100%;
height: 100%;
min-width: 100%;
} */
#map {
width: 100%;
height: 100%;
}
</style>
</head>
<body>
<div id="map" ></div>

<script>
//----------------绘制底图
var mymap = L.map('map').setView([ 20,120], 5);
mymap.zoomControl.setPosition('topright');
// var url = 'http://localhost:8080/xyz/roadmap/{z}/{x}/{y}.png';
// var url = './roadmap/{z}/{x}/{y}.png'
// var url = 'https://{s}.tile.openstreetmap.org/{z}/{x}/{y}.png'
var url = "https://api.mapbox.com/styles/v1/{id}/tiles/{z}/{x}/{y}?access_token=pk.eyJ1IjoibWFwYm94IiwiYSI6ImNpejY4NXVycTA2emYycXBndHRqcmZ3N3gifQ.rJcFIG214AriISLbB6B5aw"
// var url = 'http://services.arcgisonline.com/ArcGIS/rest/services/World_Imagery/MapServer/tile/{z}/{y}/{x}'
L.tileLayer( url , {
maxZoom: 18,
minZoom:2,
id: 'mapbox/streets-v11',
tileSize: 512,
zoomOffset: -1
}).addTo(mymap);


</script>


</body>
</html>

功能一:热力图

依赖包:

1
<script src="./js/leaflet-heat.js"></script>

heatpoint数据文件:

1
2
3
4
5
6
7
8
var heatpoint = [
[ 25.277312550 , 124.687775915409,"486"],
[ 27.72593995 , 124.474295839426, "807"],
[ 27, 125,"899"],
[ 28,126,"1273"],
[ 28,126.5 , "1258"],
[ 28, 126.6,"1279"]
]
1
2
3
//---------------------------------------------增加热力图  lat, lng, intensity
var layerHeat = L.heatLayer(heatpoint, {radius: 10});
mymap.addLayer(layerHeat);

在这里插入图片描述

功能二:GeoJson轨迹

GeoJson数据格式:这里我采用的是对不同轨迹上不同颜色,对原始版本进行了修改。
轨迹构成面:
数据这里省略了

1
2
3
4
5
6
7
8
9
10
11
12
13
14
15
16
17
18
19
20
21
var states= [{
"type": "Feature",
"properties": {"id": "1","color":"#BB443E"},
"geometry": {
"type": "Polygon",
"coordinates": [[
[ , ],
[ , ]
]]
}
}, {
"type": "Feature",
"properties": {"id": "2","color":"#000000"},
"geometry": {
"type": "Polygon",
"coordinates": [[
[ , ],
[ , ]
]]
}
}]

轨迹线:

1
2
3
4
5
6
7
8
9
10
11
12
13
14
15
16
17
18
19
20
21
var states= [{
"type": "Feature",
"properties": {"id": "1","color":"#BB443E"},
"geometry": {
"type": "LineString",
"coordinates": [
[ , ],
[ , ]
]
}
}, {
"type": "Feature",
"properties": {"id": "2","color":"#000000"},
"geometry": {
"type": "LineString",
"coordinates": [
[ , ],
[ , ]
]
}
}]

外部导入数据:

1
<script type="text/javascript" src="./json/geoJson.js"></script>

调用:

1
2
3
4
5
6
7
8
9
10
11
12
13
14
15
16
17
 
var myStyle = {
"color": '#101010',
"weight": 3,
"opacity": 0.5,

};
var layerGeo = L.geoJSON(states, {
style: function (feature) {
if(feature.geometry.type == "LineString") {
return {color: feature.properties.color}
}
else {
return {color: feature.properties.color}
}
}
}).addTo(mymap)

功能三:marker

1
2
3
4
5
6
7
8
9
10
11
12
13
14
var icon = new L.icon({iconUrl: './css/images/fig.svg',
iconSize: [20, 20], // size of the icon
// shadowSize: [50, 64], // size of the shadow
iconAnchor: [22, 94], // point of the icon which will correspond to marker's location
shadowAnchor: [4, 62], // the same for the shadow
popupAnchor: [-3, -76] // point from which the popup should open relative to the iconAnchor
})

marker = new L.marker(loc,{icon: icon} );//se property
marker.addTo(mymap)
// searched
marker.bindPopup('area: '+ title );

}

功能四:轨迹动画(从A->B)

参考github
官方demo

1
2
<!-- 动画轨迹js -->
<script type="text/javascript" src="./js/MovingMarker.js"></script>

调用多个动画效果:

1
2
3
4
5
6
7
8
9
10
11
12
13
14
15
16
17
18
19
20
21
22
23
24
25
26
27
28
29
30
31
32
33
34
35
36
37
38
39
40
41
42
43
44
45
46
47
48
49
50
51
52
53
54
55
56
57
58
59
60
61
62
63
64
65
66
67
68
69
70
71
72
73
74
75
76
77
78
79
80
81
82
83
84
85
86
87
88
89
90
// ---------------------------------------------geo的动画 L.Marker.movingMarker-------------------------------------
var parisKievLL = [[48.8567, 2.3508], [50.45, 30.523333]];
var londonParisRomeBerlinBucarest = [[51.507222, -0.1275], [48.8567, 2.3508],
[41.9, 12.5], [52.516667, 13.383333], [44.4166,26.1]];
var londonBrusselFrankfurtAmsterdamLondon = [[51.507222, -0.1275], [50.85, 4.35],
[50.116667, 8.683333], [52.366667, 4.9], [51.507222, -0.1275]];
var barcelonePerpignanPauBordeauxMarseilleMonaco = [
[41.385064, 2.173403],
[42.698611, 2.895556],
[43.3017, -0.3686],
[44.837912, -0.579541],
[43.296346, 5.369889],
[43.738418, 7.424616]
];

var planeIcon = new L.icon({iconUrl: './css/images/marker-icon-2x.png',
iconSize: [40, 70],
iconAnchor: [22, 94],
popupAnchor: [-3, -76],
shadowUrl: './css/images/marker-shadow.png',
shadowSize: [68, 95],
shadowAnchor: [22, 94]
})


// -------------用户点击开始轨迹动画
var marker1 = L.Marker.movingMarker(parisKievLL, [10000]).addTo(mymap);
L.polyline(parisKievLL).addTo(mymap);
marker1.once('click', function () {
marker1.start();
marker1.closePopup();
marker1.unbindPopup();
marker1.on('click', function() {
if (marker1.isRunning()) {
marker1.pause();
} else {
marker1.start();
}
});
setTimeout(function() {
marker1.bindPopup('<b>Click me to pause !</b>').openPopup();
}, 2000);
});

marker1.bindPopup('<b>Click me to start !</b>', {closeOnClick: false});
marker1.openPopup();

// -------------自动播放轨迹动画
var marker2 = L.Marker.movingMarker(londonParisRomeBerlinBucarest,
[3000, 9000, 9000, 4000],{autostart: true}).addTo(mymap);
L.polyline(londonParisRomeBerlinBucarest, {color: 'red'}).addTo(mymap);

// -------------循环动画
var marker3 = L.Marker.movingMarker(londonBrusselFrankfurtAmsterdamLondon,
[2000, 2000, 2000, 2000], {autostart: true, loop: true}).addTo(mymap);

marker3.loops = 0;
marker3.bindPopup('', {closeOnClick: false});
L.polyline(londonBrusselFrankfurtAmsterdamLondon, {color: 'black'}).addTo(mymap);

marker3.on('loop', function(e) {
marker3.loops++;
if (e.elapsedTime < 50) {
marker3.getPopup().setContent("<b>Loop: " + marker3.loops + "</b>")
marker3.openPopup();
setTimeout(function() {
marker3.closePopup();

if (! marker1.isEnded()) {
marker1.openPopup();
} else {
if (marker4.getLatLng().equals([45.816667, 15.983333])) {
marker4.bindPopup('Click on the map to move me !');
marker4.openPopup();
}

}

}, 2000);
}
});


// -------------根据用户的鼠标点击来运动 不精确

var marker4 = L.Marker.movingMarker([[45.816667, 15.983333]], [],{icon: planeIcon}).addTo(mymap);

mymap.on("click", function(e) {
marker4.moveTo(e.latlng, 2000);
});

功能五:轨迹动画(轨迹自身动画)

依赖:

1
2
3
4
<!-- 导入动画效果DashFlow -->
<script src="./js/L.Path.DashFlow.js"></script>
<!-- 导入DashFlow动画依赖 轨迹线path -->
<script src="./json/route.js"></script>

调用:

1
2
3
4
5
6
7
8
9
10
11
12
13
14
15
16
17
18
19
20
21
22
/ ---------------------------------------------添加动画效果DashFlow
for (var i = 0, latlngs = [], len = route.length; i < len; i++) {
latlngs.push(new L.LatLng(route[i][0], route[i][1]));
}

var path = L.polyline(latlngs, {
dashArray: "15,15",
dashSpeed: -30
});

mymap.fitBounds(L.latLngBounds(latlngs));

mymap.addLayer(L.marker(latlngs[0]));
mymap.addLayer(L.marker(latlngs[len - 1]));

mymap.addLayer(path);//添加一个path动画

L.circleMarker([10, 70], {
dashArray: "15,15",
dashSpeed: -30,
radius: 147.5
}).addTo(mymap); //添加以中心点 半径画圆的 动画效果

功能六:用户标注侧栏

在这里插入图片描述

1
2
3
<!-- 导入画图组件的依赖 -->
<script src='./js/leaflet.draw.js'></script>
<link rel="stylesheet" href="https://api.mapbox.com/mapbox.js/plugins/leaflet-draw/v0.4.10/leaflet.draw.css"/>

调用:

1
2
3
4
5
6
7
8
9
10
11
12
13
14
//---------------------------------------------增加右侧用户画图toolbar
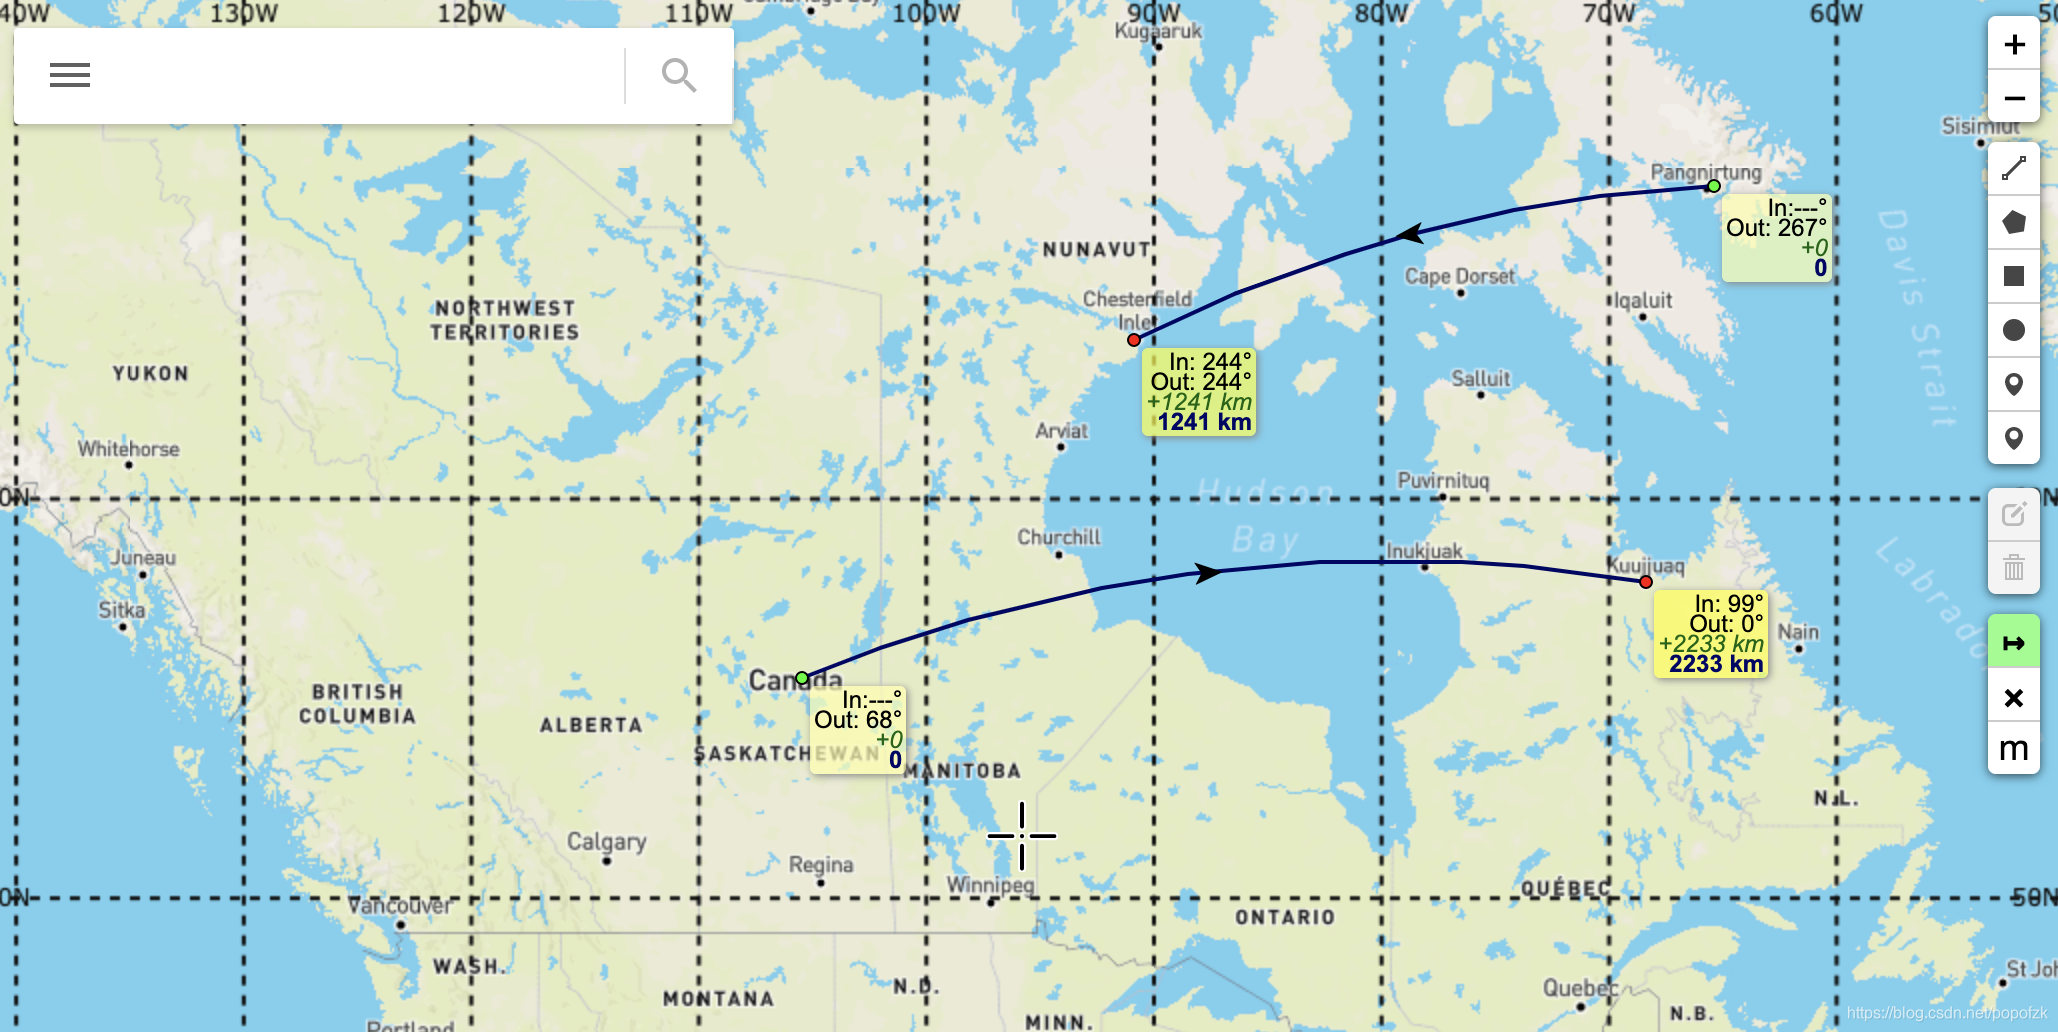
var drawnItems = new L.FeatureGroup();
mymap.addLayer(drawnItems);
var drawControl = new L.Control.Draw({position: 'topright',
edit: {
featureGroup: drawnItems
}
});
mymap.addControl(drawControl);
mymap.on(L.Draw.Event.CREATED, function (event) {
var layer = event.layer;

drawnItems.addLayer(layer);
});

功能七:测量工具(m/nm/mi)

导入依赖:

1
2
3
 <!-- 测量工具 Leaflet.PolylineMeasure-->
<script src="./js/Lealet.PolylineMeasure.js"></script>
<link rel="stylesheet" href="./css/Leaflet.PolylineMeasure.css" />
1
2
3
4
5
6
7
8
9
10
11
12
13
14
15
16
//  ---------------------------------------------测量工具Leaflet.PolylineMeasure
L.control.scale ({maxWidth:240, metric:true, imperial:false, position: 'bottomleft'}).addTo (mymap);
let polylineMeasure = L.control.polylineMeasure ({position:'topright', unit:'metres', showBearings:true, clearMeasurementsOnStop: false, showClearControl: true, showUnitControl: true})
polylineMeasure.addTo (mymap);

function debugevent(e) { console.debug(e.type, e, polylineMeasure._currentLine) }

mymap.on('polylinemeasure:toggle', debugevent);
mymap.on('polylinemeasure:start', debugevent);
mymap.on('polylinemeasure:resume', debugevent);
mymap.on('polylinemeasure:finish', debugevent);
mymap.on('polylinemeasure:clear', debugevent);
mymap.on('polylinemeasure:add', debugevent);
mymap.on('polylinemeasure:insert', debugevent);
mymap.on('polylinemeasure:move', debugevent);
mymap.on('polylinemeasure:remove', debugevent);

在这里插入图片描述

功能八:经纬度显示

1
2
3
4
5
6
7
8
9
10
11
12
13
// --------------------------------------------绘制经纬度网格线 Specify divisions every 10 degrees
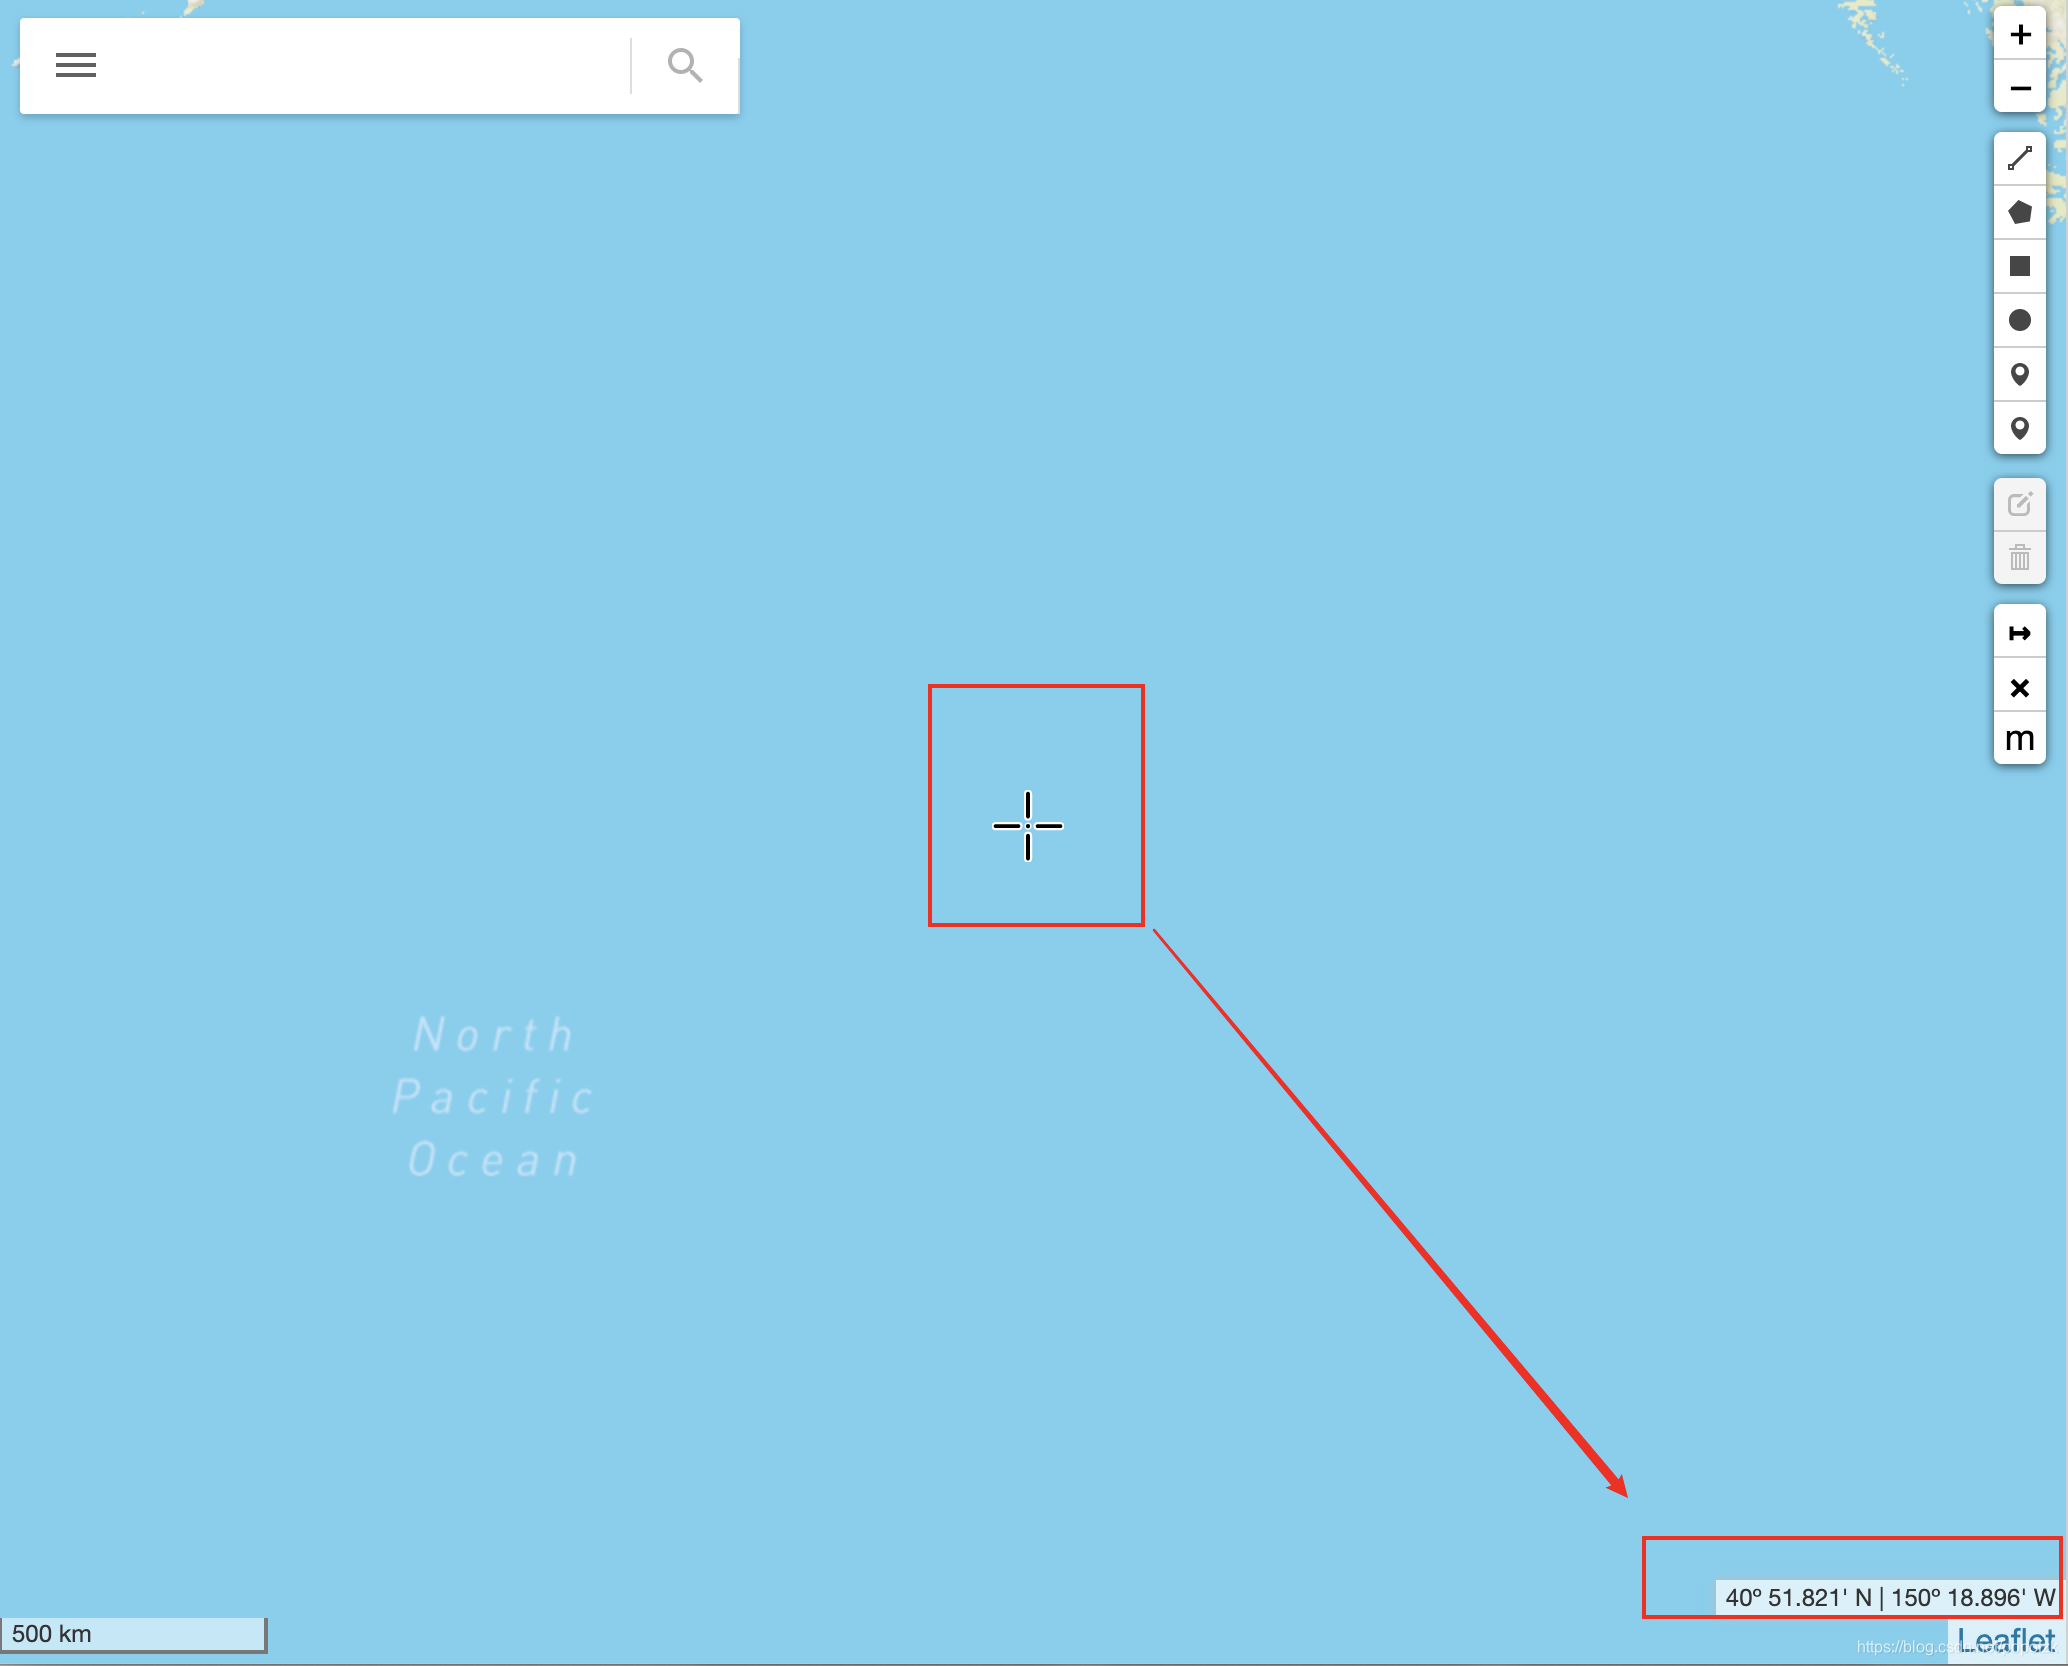
L.latlngGraticule({
weight: "2.0",
color: '#101010',
showLabel: true,
dashArray: [5, 5],
zoomInterval: [
{start: 2, end: 3, interval: 30},
{start: 4, end: 4, interval: 10},
{start: 5, end: 7, interval: 5},
{start: 8, end: 10, interval: 1}
]
}).addTo(mymap);

在这里插入图片描述

功能九:中心坐标显示

依赖:

1
2
3
<!-- 坐标显示  中心坐标 底部显示 -->
<link rel="stylesheet" href="http://xguaita.github.io/Leaflet.MapCenterCoord/dist/L.Control.MapCenterCoord.min.css" />
<script src="http://xguaita.github.io/Leaflet.MapCenterCoord/dist/L.Control.MapCenterCoord.min.js"></script>

调用:

1
2
3
4
5
6
7
8
// ---------------------------------------------添加屏幕中心坐标的底部显示
L.control.mapCenterCoord(
{
latlngFormat: 'DM',
latlngDesignators: true,
position: "bottomright"
}
).addTo(mymap);

在这里插入图片描述

功能十:仿谷歌搜索框

参考github

依赖:

1
2
3
4
5
6
<!-- 搜索框 谷歌风格 -->
<!-- <script src="https://code.jquery.com/jquery-1.12.1.min.js"></script> -->
<script src="./js/jquery.min.js"></script>
<script src="https://cdn.bootcdn.net/ajax/libs/jqueryui/1.8.24/jquery-ui.min.js"></script>
<script src="./js/leaflet.customsearchbox.min.js"></script>
<link href="./css/searchbox.min.css" rel="stylesheet" />

调用:

1
2
3
4
5
6
7
8
9
10
11
12
13
14
15
16
17
18
19
20
21
22
23
24
25
26
27
28
29
30
31
var searchboxControl=createSearchboxControl();
var control = new searchboxControl({
sidebarTitleText: 'Header',
sidebarMenuItems: {
Items: [
{ type: "link", name: "Link 1 (github.com)", href: "http://github.com", icon: "icon-local-carwash" },
{ type: "link", name: "Link 2 (google.com)", href: "http://google.com", icon: "icon-cloudy" },
{ type: "button", name: "Button 1", onclick: "alert('button 1 clicked !')", icon: "icon-potrait" },
{ type: "button", name: "Button 2", onclick: "button2_click();", icon: "icon-local-dining" },
{ type: "link", name: "Link 3 (stackoverflow.com)", href: 'http://stackoverflow.com', icon: "icon-bike" },

]
}
});

control._searchfunctionCallBack = function (searchkeywords)
{
if (!searchkeywords) {
searchkeywords = "The search call back is clicked !!"
}
alert(searchkeywords);
}

mymap.addControl(control);
});

function button2_click()
{
alert('button 2 clicked !!!');

}

这里的搜索框提供了一个模板,可根据自己需求修改函数、按钮等

功能十一:搜索框的自动补全

采用jquery的input框自动补全组件
依赖:

1
2
3
4
5
<!-- 搜索框补全功能jquery -->
<!-- <script type="text/javascript" src="http://code.jquery.com/jquery-1.8.3.js"></script> -->
<script src="http://libs.baidu.com/jquery/1.8.3/jquery.js"></script>
<script src="https://cdn.bootcdn.net/ajax/libs/jqueryui/1.10.3/jquery-ui.js"></script>
<link rel="stylesheet" href="http://code.jquery.com/ui/1.10.3/themes/smoothness/jquery-ui.css" />

这里用jquery组件来绑定searchboxinput(上一个谷歌搜索框),导入的数据采用数组形式即可。
调用:

1
2
3
4
5
6
7
8
9
10
// ----------------------------------------------搜索框自动补全 jquery----------------------
var cityData = []
//自动填充1
$( "#searchboxinput" ).autocomplete({
source: cityData,
messages: {
noResults: '',
results: function() {}
}
});